I. Summary
The price of a food basket for a family of four has risen by 1.5 percent between months. The recent increase in the basket. 6 months is 6.5 per cent, which is more than 3 per cent higher than the change in the consumer price index during the same period. The uncertainty in the measurement is 2.5 percent, which is due to volatility in the food market in recent weeks.
II. Basket survey
The following changes had taken place in basket 1 since last September:
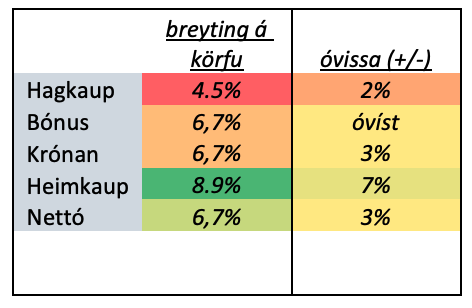
The weighted average increase in the shopping basket is 6.5 percent and the uncertainty 2.5 percent as previously stated. In this half year, the CPI has risen by 4.1% percent. This is shown in the image below.
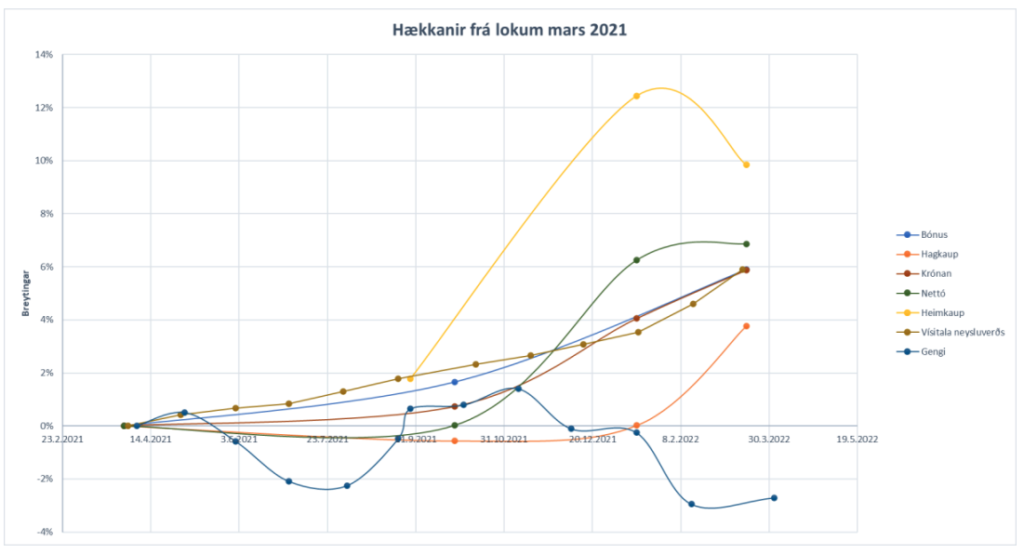
Food prices have therefore risen similarly to consumer price indices in recent years. However, it rose slightly from the end of March until September 2021 (around 1%). The increase is 1.5 per cent from February, which is considerably more than the increase measured by Statistics Iceland in March.
III. Indices of individual stores
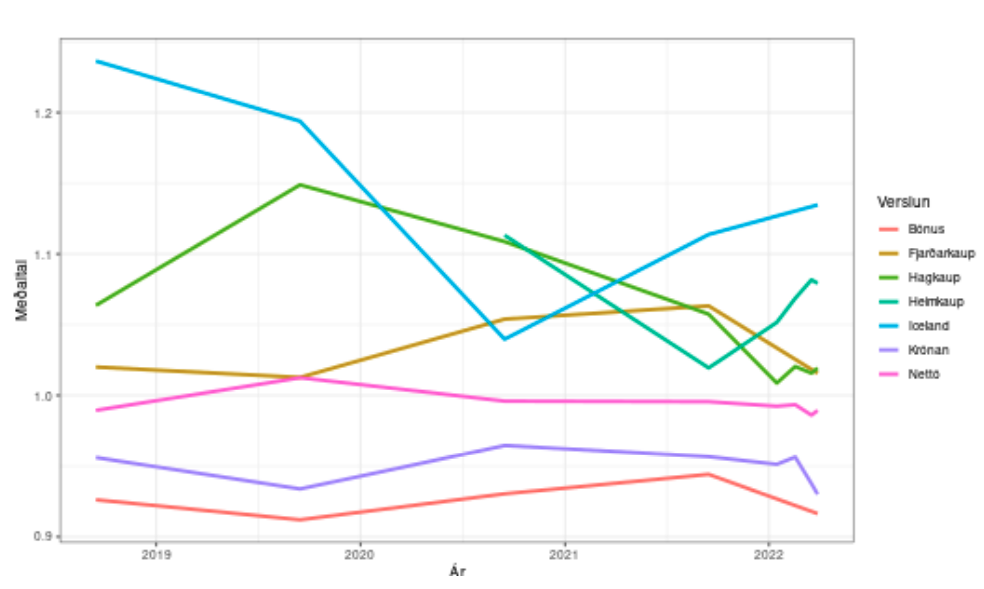
On the basis of the ASÍ survey, indices were calculated for product prices in individual stores. The development of the internal indices of individual stores is shown below:
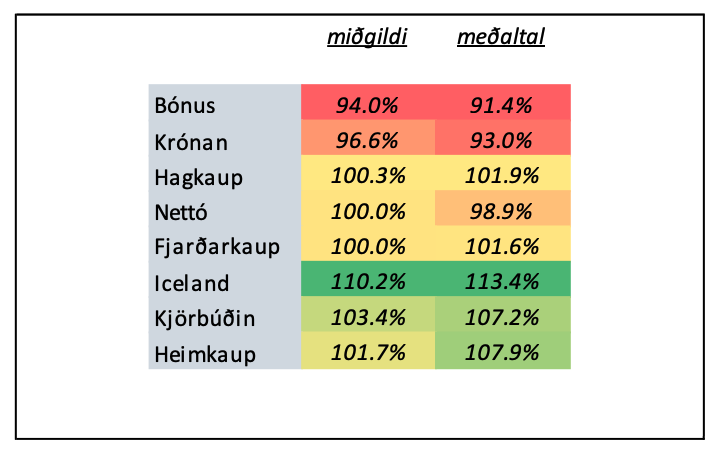
As can be seen in the picture below, the gap between stores has been narrowing and competition seems to be increasing since 2019. In particular, Hagkaup and later Fjarðarkaup have been lowering their prices.
IV. Product shortage
There were a number of product cards in the survey. On average, about 14% were missing from the products that ASÍ was measuring, and this primarily reflects different emphases in product selection. Bonus stood out and was missing 35 of the products covered by the survey. There were some key products missing, such as: Homemade bread crumbs, Whole frozen chicken, frozen lamb thighs, Nesbú happy eggs, Frón milk biscuits and green grapes. An overview of the product card can be seen below in the table:

A survey in Bónus was conducted in Selfoss, so it may not reflect the product range in all
Bonus shops.
V. Easter eggs have fallen in price
ASÍ examined the price of Easter eggs. A total of 15 eggs were examined, which were also on sale last year. The survey shows that most stores have reduced prices on average
Easter eggs. The change varies from store to store:

VI. Comments
In the explanatory notes to the ASÍ survey, the main emphasis is on the difference between the highest and lowest product prices. This method does not measure the actual price difference between stores. The following table is given:
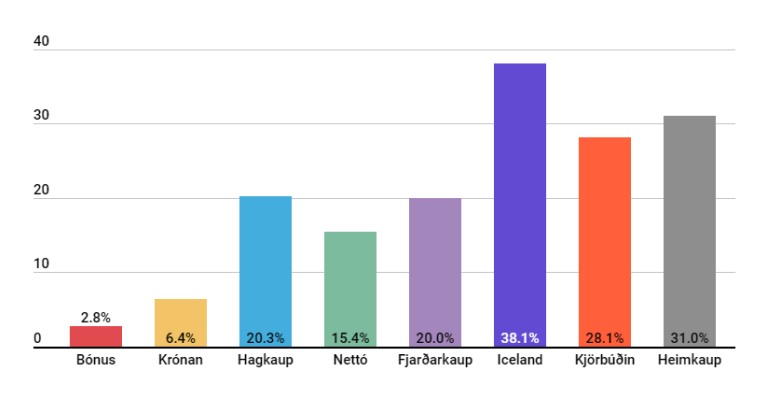
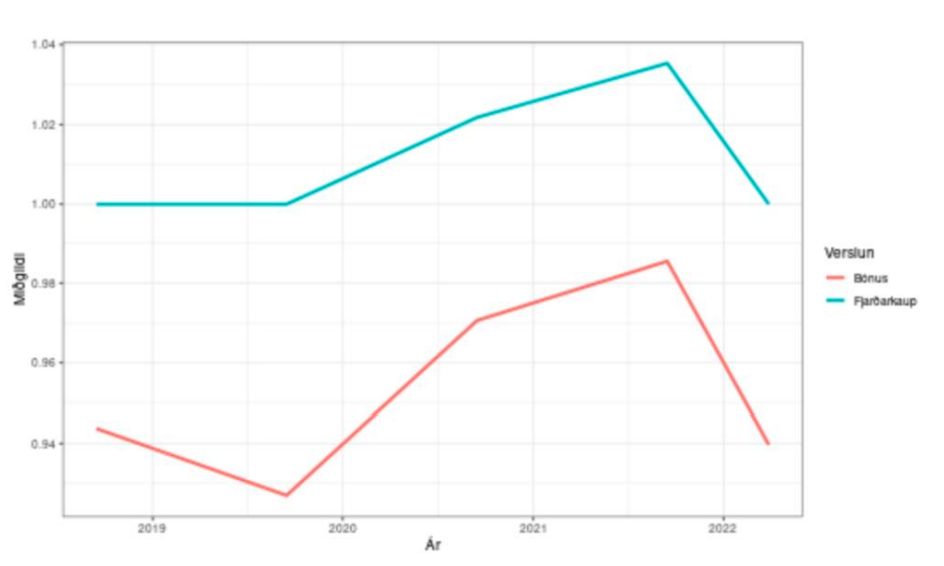
This tablet is misleading. A consumer who reads from it could thus assume that the difference between the price in Fjarðarkaupur and Bónus was general (20.0-2.8) = 17.2%. This is far from true. The truth is that the difference is around 6% - 7.5% and has been more or less the same in all price surveys in Asia recently. 3 years as the attached picture shows:
To better understand this, it is a good idea to check the enclosed box for the survey:
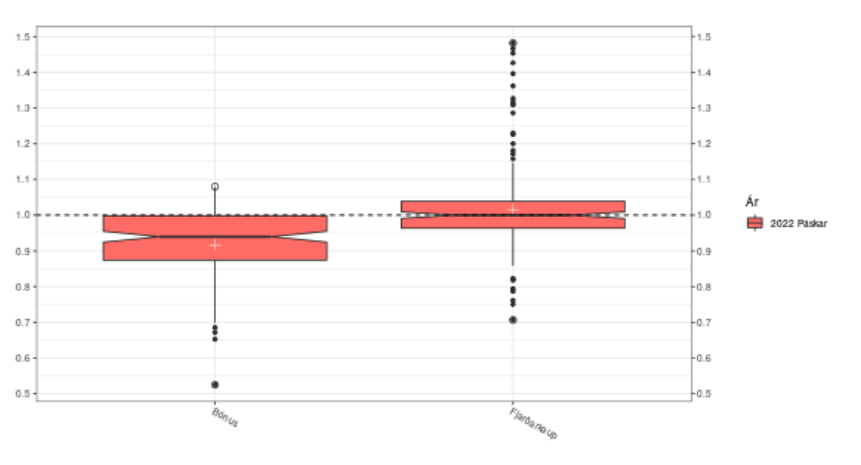
The figure shows that the difference between the median is about 6% and the averages about 7.5%. The difference in the measurements is due to the fact that there is considerable volatility in the pricing of Fjarðarkaup. The measure that Asia uses for interpretation can thus more than double the difference that actually exists between the median and average prices in the stores.
VII. Shopping baskets
Veritabus publishes monthly changes to a traditional branded shopping cart. However, no distinction is made between related products such as Andrax and Lamba toilet paper. Work is underway to develop another shopping basket that will be based on the cheapest options in each product category. It is hoped that it will be possible to start using this basket this autumn.
VIII. About Veritabus and the price survey
Veritabus is a sister company of Arev Securities Company. All Veritabus price surveys as well as other public price surveys can be found on the Veritabus website for subscribers.
The ASÍ price survey examined the prices of 165 items. Of these, 30 were Easter eggs. About half of them were also in the ASÍ survey a year ago.

