

The monthly average annual number of tourists is now just under 2.0 million. The forecast predicts that the average will fall to 1.8 million in March/April 2020, but that it will then begin to grow again.
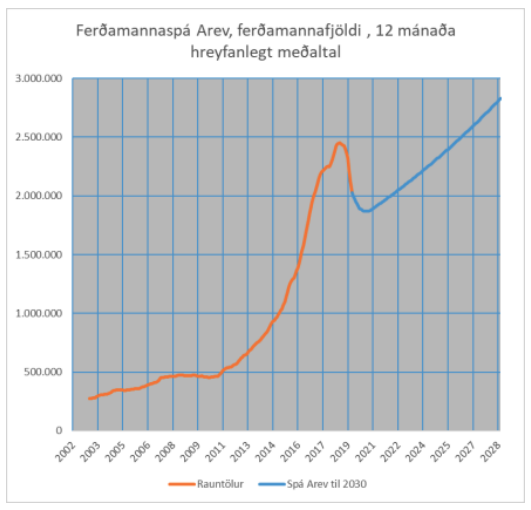
The right-hand axis of the chart on the left shows that, until mid-2017, the monthly annual average continued to increase proportionally. In 2017, this began to reverse, and the average has now been decreasing by 17-20% per month. In October 2019, the decrease was 19.2%. The average is now just under 2.0 m. It will be down to 1.9 m. by the end of the year. WOW began to reduce its supply in October 2018. Despite this, the average will continue to fall at least until March, in line with official seat supply figures.
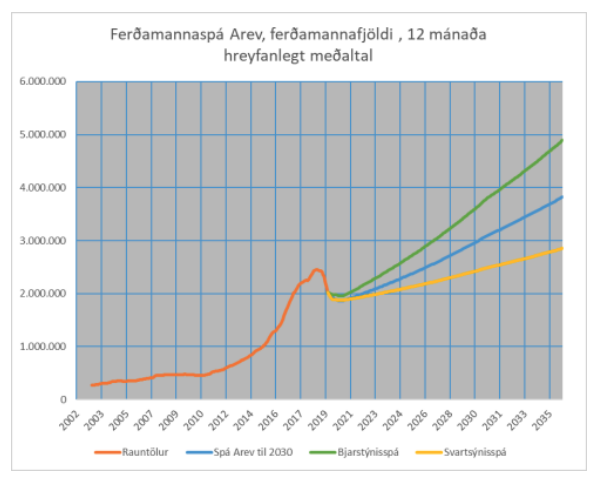
The average will fall to 1.9 m. by the end of the year, and the total number of tourists for the year 2019 will be around or over 1.9 m. The average will fall to 1.8 m. in March/April 2020. Arev then set up two other scenarios. According to the optimistic scenario (the green line), the average will fall to just over 1.9 m. and start to grow again. According to the pessimistic scenario (the yellow line), the average will fall to just over 1.7 m before it starts to grow again.
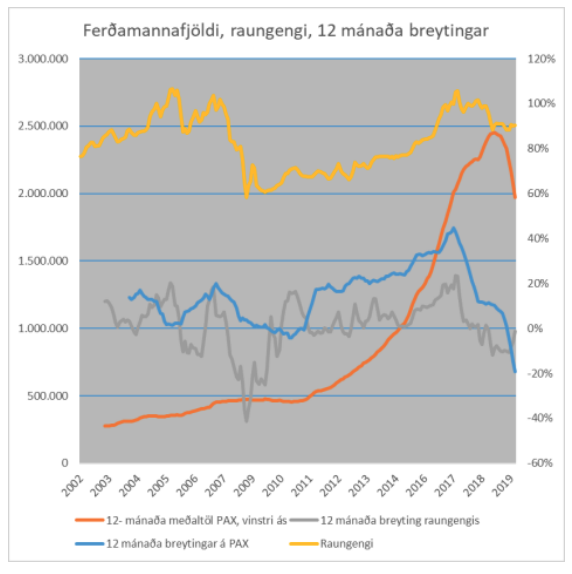
Finally, to the side is a graph showing the relationship between the real exchange rate and the number of tourists. The yellow line shows the real exchange rate of the Icelandic króna and the brown line shows the number of tourists. As can be seen, the significant increase in the real exchange rate since 2015 appears to result in a decrease in tourist numbers 12 to 24 months later. The effects therefore take a long time to become apparent, which is not unexpected as the tourism industry follows the seasons and generally both tour operators and tourists have some lead time for their trips. However, changes in tourist numbers and the real exchange rate are closely related over time, as is to be expected, since changes in foreign currency inflows in the short term are partly determined by the number of tourists. These variables are therefore dependent on each other. The blue and grey lines thus largely describe the same thing.