

Below you can see how the inflation-linked yield on the City of Reykjavík and Orkuveitan has been moving this autumn. The chart shows the yield in September (x) and November (o) for individual bonds of RVÍK and OR as they appear here. The blue and yellow lines are found using the Nelson–Siegel–Svenson method. The method uses mathematical techniques to draw a smooth line through the yield curve for different lengths of bonds.
It is reasonable to assume that the bonds of RVÍK and OR will have the same yield requirement, as the issuers of the bonds are in the same group. The blue line in September illustrates this quite well. In November, however, investors seem to have started to demand a lower yield on RVÍK bonds and a higher one on OR bonds. The green line, which covers only RVÍK bonds, illustrates this well.
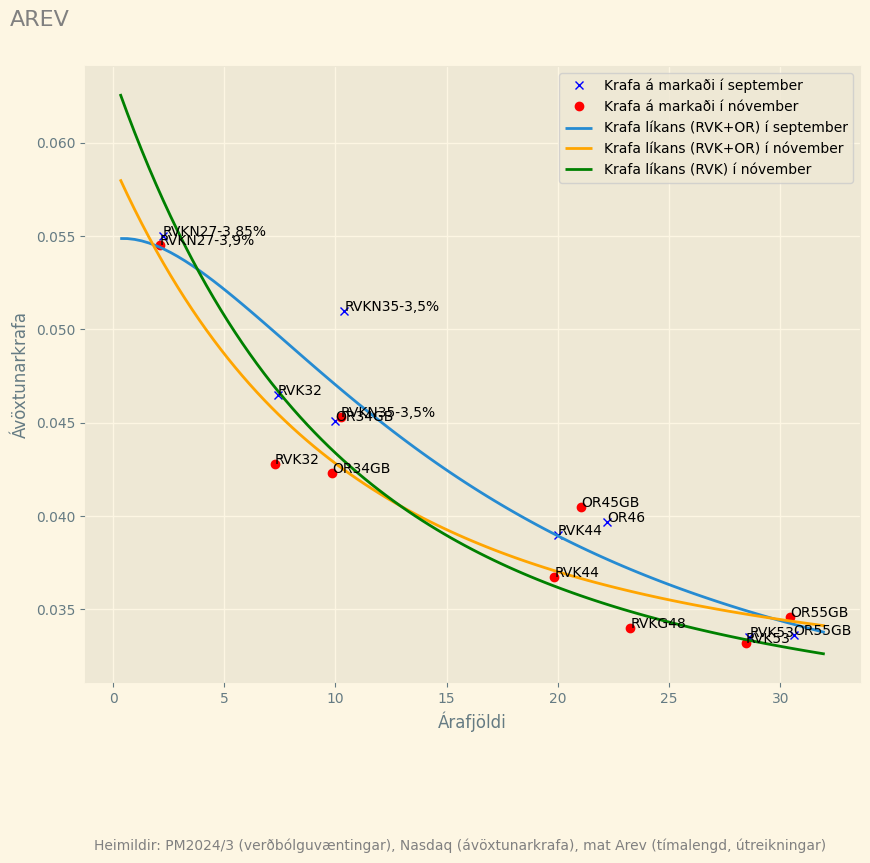
It seems that a better annual report and changes in borrowing requirements have lowered investors' demand for the City of Reykjavik.
Orkuveitan has significant need for debt financing and the uncertain position of its subsidiaries, as revealed in the group's financial forecast published at the end of October, appear to be increasing investors' demands on the company's bonds.