

Below are two pictures showing the prevalence of farmed salmon in key streams in the West and North West:
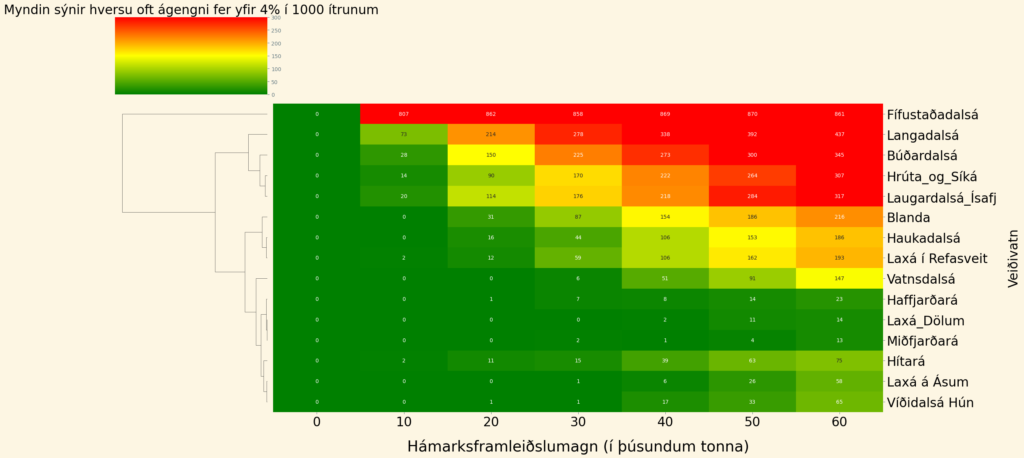
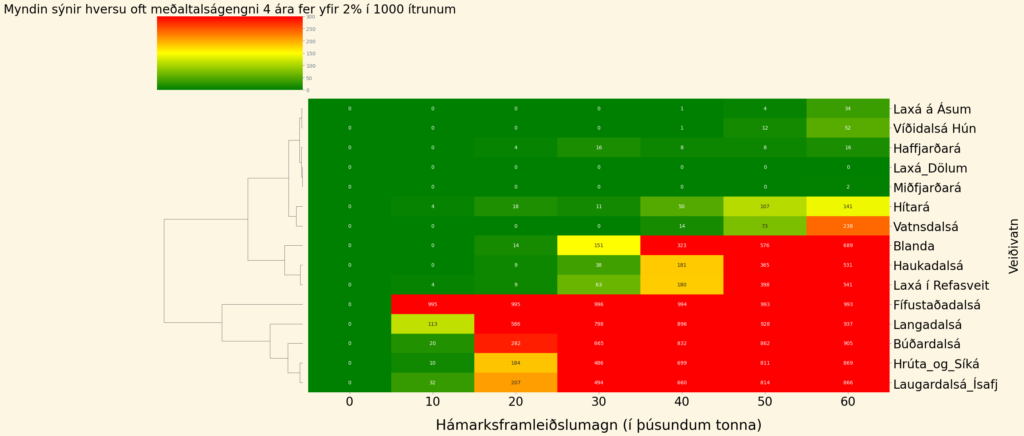
Below are images of all the fishing lakes in the West and Northwest regions that are featured in the monitoring report. the Marine and Freshwater Research Institute:
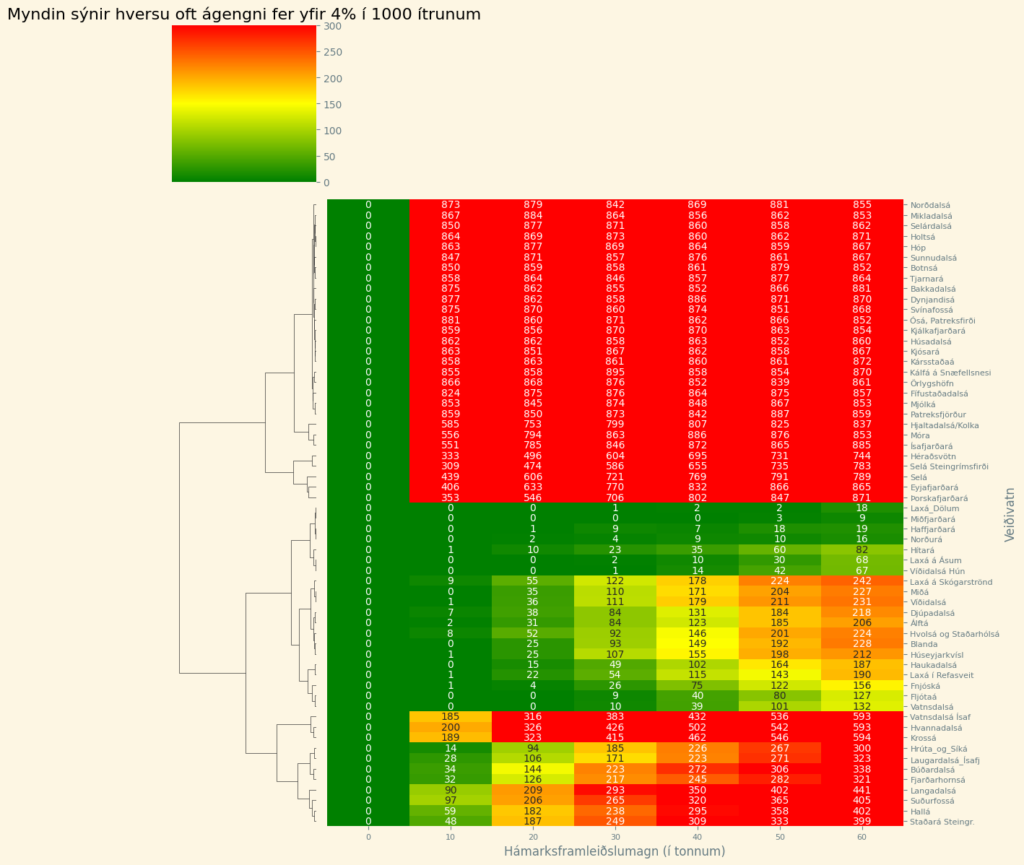
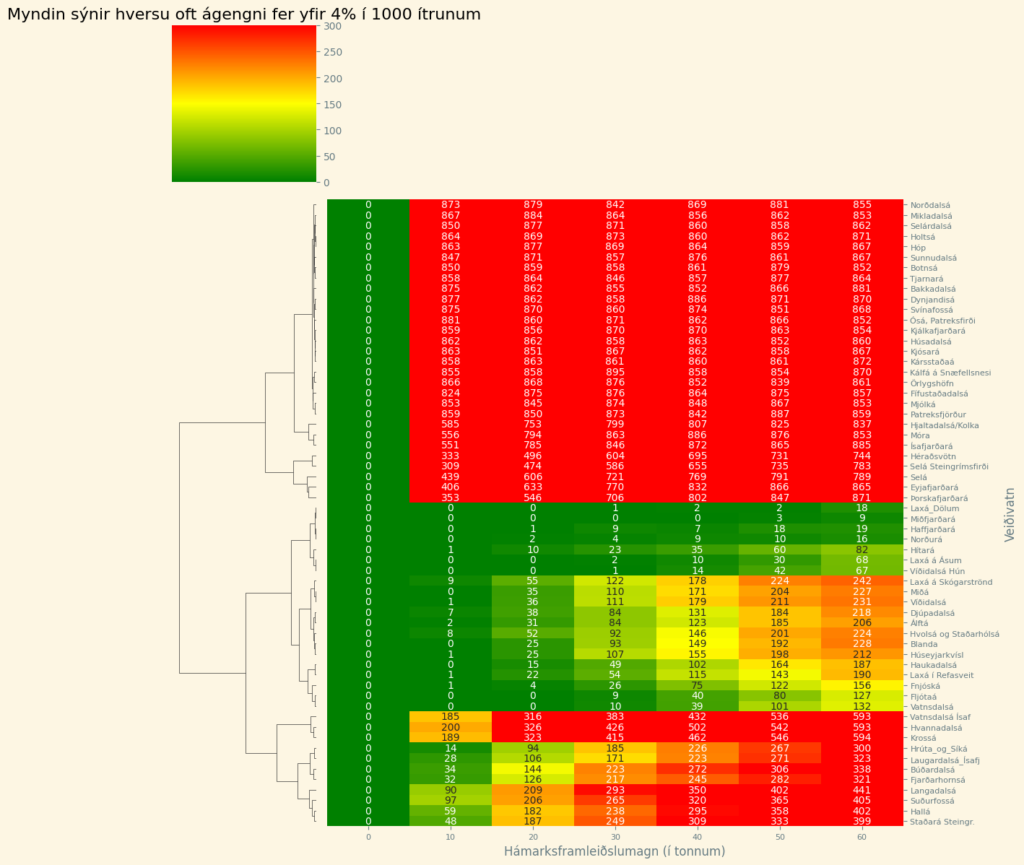
Development of a simulation model for risk assessment
Data files used in risk assessment
Westfjords (rivers and pools)
Contains coordinates of fjords with cages and maximum production in each fjord.
Contains coordinates of fishing waters, five-year average catch, standard deviation, fishing pressure, number of escaped salmon, and information on whether to publish details about the fishing water in the final results, and whether it is anti-clockwise or clockwise of the production area, and whether natural barriers impede the passage of escaped salmon.
Eastfjords (rivers and pools)
Same information as above.
Innlestur jaðarhnita for the Westfjords Peninsula, Westland and North-Westland and read-inof extreme coordinates for the Eastfjords
Here A more detailed description of the simulation model used in risk assessment.
Programme to estimate distances from cages in a river.
The application receives the coordinates of hunting lakes and enclosures and calculates the distances between them using the Haversine formula.
An application that uses machine learning to create predictive models for individual fishing lakes.
The app gets information about fishing lakes and learns from the Kvígindisdal accident using machine learning. It creates a model.
which, based on information about escapement, predicts how many late and early fish will
into a specified body of water. The quotas are different for accidents in the Westfjords and in East Iceland.
Utility for creating a distribution for simulation
The program takes in a parameter in a Poisson distribution and the number of periods. It then returns a matrix with annual
distributions of late and early strokes. The number of years is determined by how often to simulate, but we
We have performed 1000 repetitions and the results are consistent.
Simulation loop
Processes each fishing water. Obtains a new distribution for the simulation. Manually selects a pen. Generates escape events according to probability distributions. Uses the distance between the pen and the fishing water to estimate how many escaped salmon arrive at each fishing water each year. Calculates how often the proportion of escapees exceeds 4% and how often the 4-year average escapement exceeds 2%. This is done for different production levels.
Graphical representation for risk assessment
A programme that presents simulation results in a graphical way.
This post was updated on 10/02/2025