Underlining of inflation
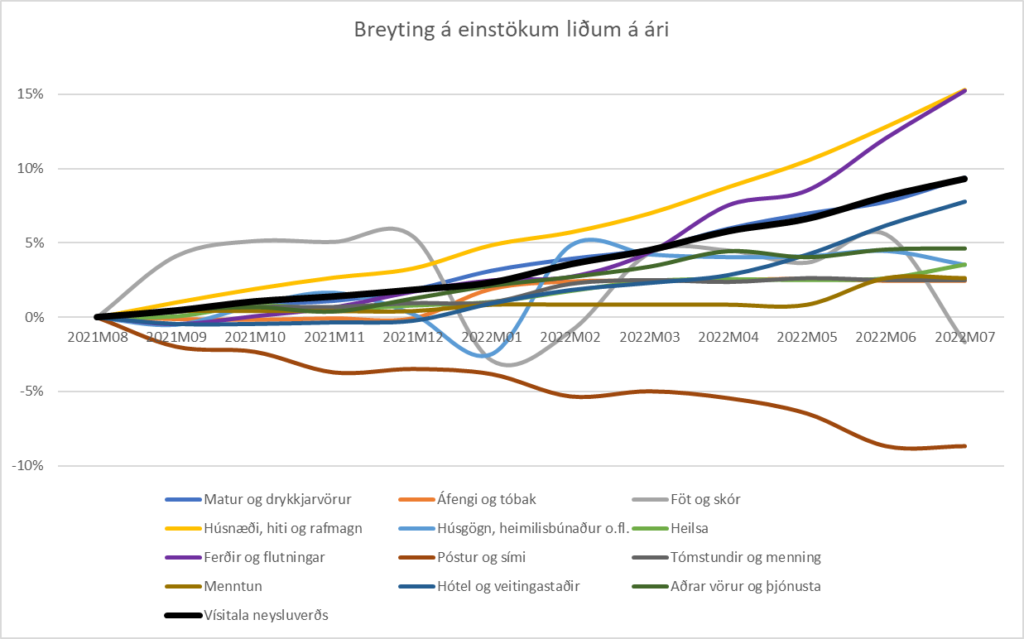
| Items | Change between months | Change in one year | Uncertainty (+/-) |
| Food and beverages | 1,5% | 9,4% | 0,6% |
| Alcohol and tobacco | 0% | 2,4% | 0,1% |
| Clothes and shoes | -6,9% | -1,7% | 0,2% |
| Housing, heating and electricity | 2,2% | 15,3% | 1,3% |
| Furniture, household appliances, etc. | -0,9% | 3,5% | 0,3% |
| Health | 0,9% | 3,6% | 0,1% |
| Travel and transportation | 2,8% | 15,2% | 0,6% |
| Mail and phone | 0,0% | -8,7% | 0,1% |
| Leisure and culture | 0,0% | 2,5% | 0,4% |
| Education | 0,0% | 2,7% | 0,0% |
| Hotels and restaurants | 1,5% | 7,8% | 0,2% |
| Other products and services | 0,06% | 4,6% | 0,3% |
Veritabus estimates that the inflation rate between months was 1.1% and that the 12-month inflation rate is now 9.5%. Veritbus reckons that Statistics Norway's estimate will be somewhat lower, or around 9.3%. Below you can see the assessment of the development of the sub-teams


