
The annual average number of tourists is now more than 2.1 m people. The forecast assumes that the average will reach 2 m. of people in the middle of 2020 and in 1.9 m. manna a year later. Despite slightly more tourists in December than Arev had predicted, it has little or no effect on Arev's forecast.
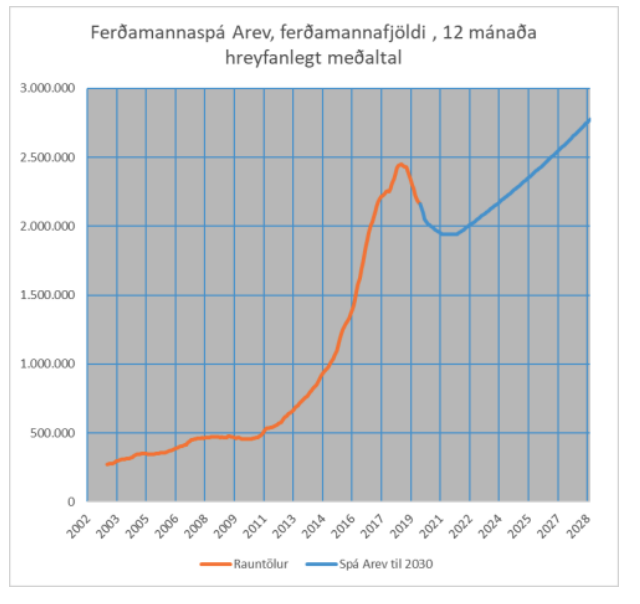
The left axis of the figure on the side shows that until the middle of 2017, the annual average continued to increase. In 2017, this turned around. In December 2019, 8.6% fewer tourists arrived than the previous year. At the same time, the annual average decreased by 0.5%. The average is now more than 2.1 m. Arev plans to bring it to 2.0 m. in the middle of 2020 and 1.9 m. a year later as the picture shows.
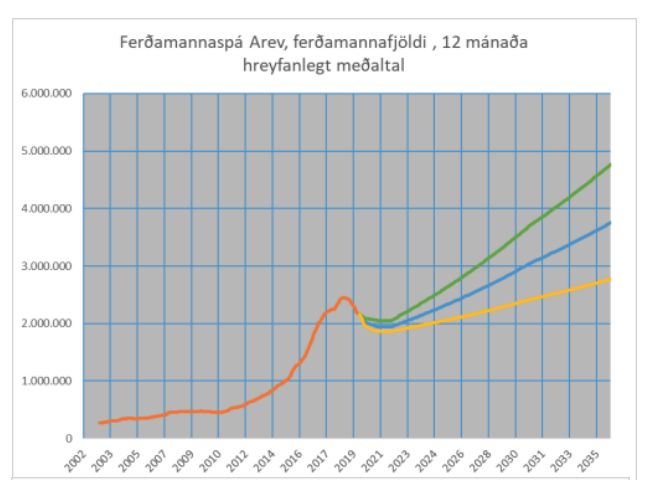
Arev then set up two other scenarios. According to the optimistic scenario (green line), the average will fall to just over 2 m. in the middle of 2021 and then start growing again. According to the pessimistic scenario (yellow line) the average will drop to just over 1.8 m. in mid-2021 before it starts growing again.
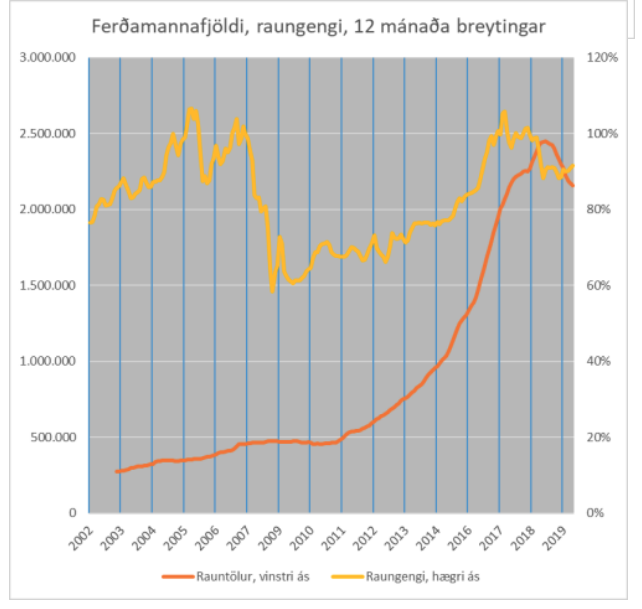
Finally, here is a picture on the side that shows the relationship between the real exchange rate and the number of tourists. The yellow line shows the real exchange rate of the Icelandic króna and the brown line the number of tourists. The large increase in tourists in recent years has greatly increased the demand for production factors such as labor and pushed up the real exchange rate. It is not seen that the falling real exchange rate has an effect on the number of tourists. Many have pointed out that the brown line in the three images reminds me of Butler's tourism model 1 which deals with the life cycle of individual tourist destinations. Butler's model is certainly worth the money, and many tourist attractions reflect its ideas well. However, the model has no statistical value, as Butler put it forward primarily to describe the life cycles of tourist attractions.